Secrets of the Top 100 Firms

It's been a difficult year for everyone, and this sampling of data, insights and analysis from Accounting Today's 2021 Top 100 Firms rankings reveals the impact it has had on the accounting profession's largest firms, as well as some of the surprising ways they came out of 2020 more strongly than you might have expected. (See the full report here. )

AT-030721-Top 100 Firms - 10 year growth rate
While the average revenue growth rate for the Top 100 Firms was half what it has been for the past several years, it was still growth, and was only their third-worst performance since 2008.
AT-030721-Top 100 Firms - Growth Rates 2019 versus 2020
All the different cohorts of the Top 100 saw slower growth rates in 2020 than in 2019, but the slowdown was much more significant for the eight firms with more than a billion dollars in revenue than for smaller firms. (It's worth noting that the Top 8 Firms' revenue is so massive that it drives trends for the overall Top 100 figures.)
AT-030721-Top 100 Firms - Top 100 Growth Rates 1994 to 2020
In the longer-term perspective, 2020 saw the Top 100 Firms' fourth-worst performance in 26 years, with only 2002, 2009 and 2010 recording lower growth rates.
AT-030921-T100 - Growth cohorts and ranges in the Top 100
There were still firms in the Top 100 that performed extremely well, but there were fewer: Only five grew by more than 20 percent, against seven in 2019. and 14 reported flat or declining revenues for 2020, against three in 2019.
AT-030921- Top 100 Firms - Growth in employees and partners
Compared to last year's figures, the number of partners and employers at the Top 100 grew at much slower rates, in some cases by half as much.
AT-030721-Top 100 Firms - revenue per partner 2020 v 2019
Despite a difficult year, revenue per partner held roughly steady with 2019; the key takeaway here is the enormous difference in leverage between the eight largest firms and the rest of the Top 100.
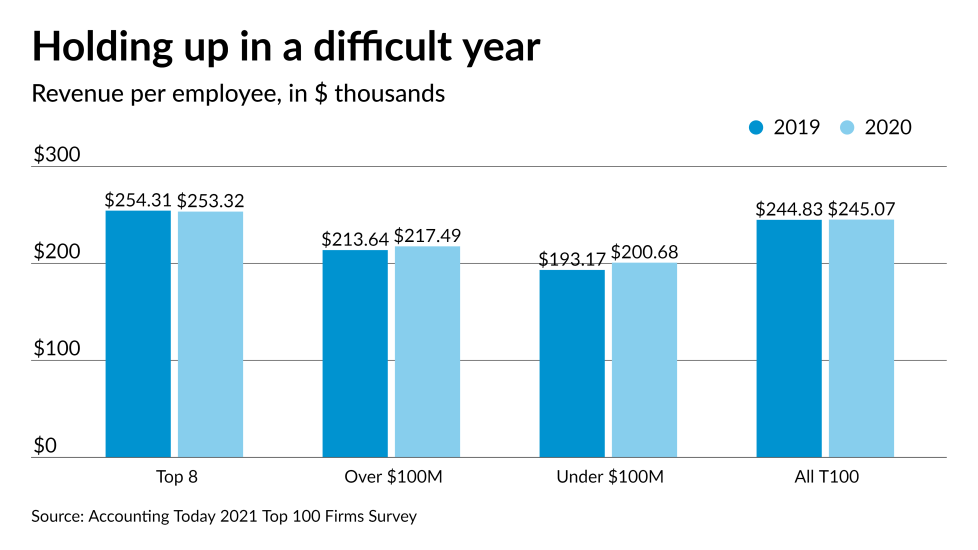
AT-030721-Top 100 Firms - Revenue per employee
Revenue per employee also remained fairly steady, while the gap between firms of different sizes is much smaller.
AT-030721-Top 100 Firms - Staff per partner 2019 v 2020
Some of the difference between the previous two charts is explained here: The billion-dollar firms don't bring in that much more revenue per employee, but they have significantly more employees per partner.
AT-030821- Top 100 Firms -- top client areas
Many of the top client niches remained the same as in 2019.
AT-030821- Top 100 Firms -- top specialty services
Not shown among these is coronavirus-related services, which was the tenth-most-commonly cited area of growth, being noted by 67 percent of the Top 100.
AT-030821- Top 100 Firms -- fee splits
The fee split figures for all the different cohorts of the Top 100 remained much the same in 2020 as in 2019, with the Top 8 displaying much more interest in MAS/consulting than the other 92 firms, and them making up most of the difference in tax services.
AT-030821- Top 100 Firms - Association and network membership
MORE FROM ACCOUNTING TODAY