Want unlimited access to top ideas and insights?
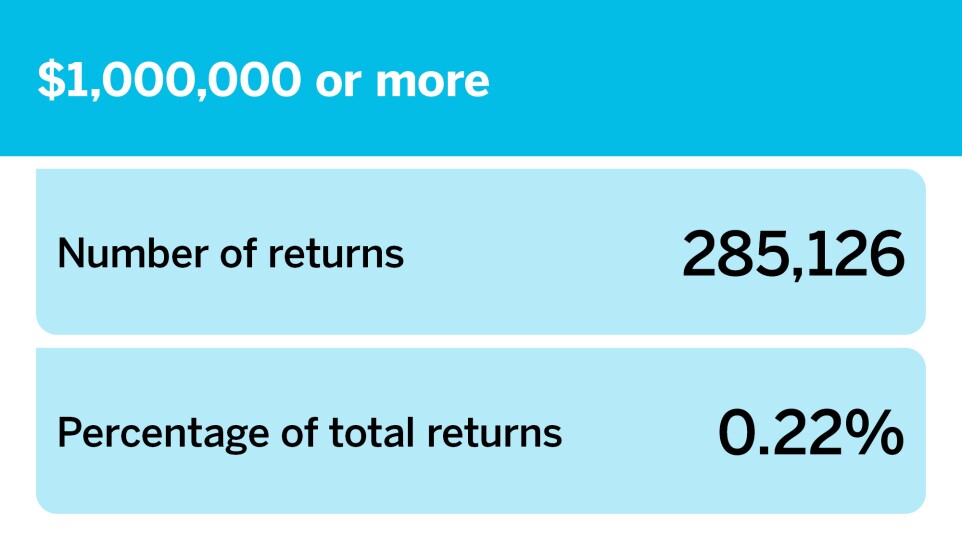
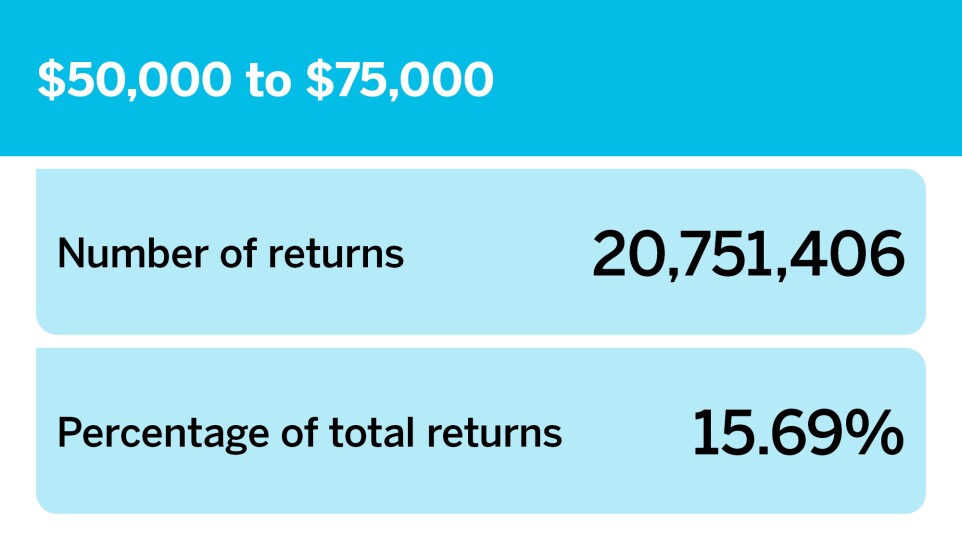
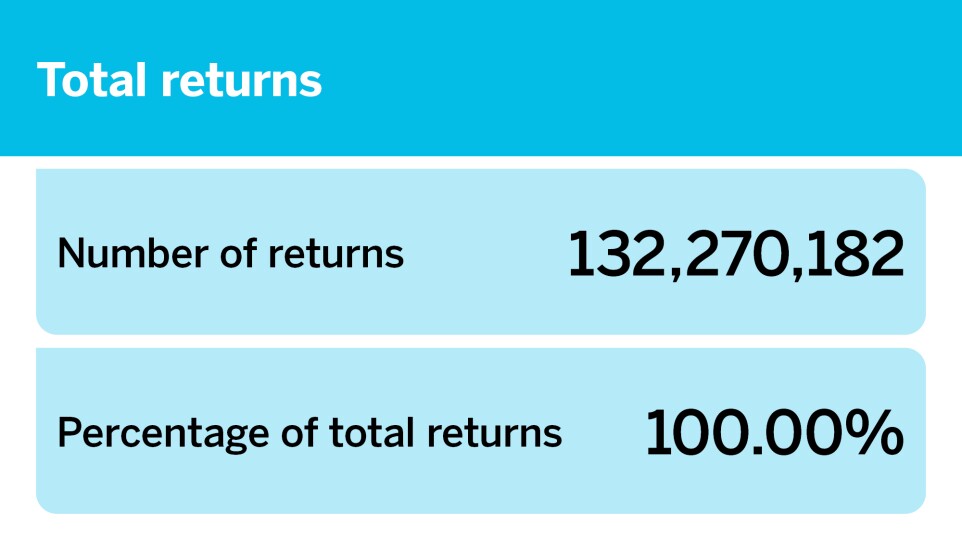
Tax season ended on April 15 and the six-month extension deadline is approaching in October. As of May 23, there were 132,270,182 total tax returns filed with the Internal Revenue Service. Measured by income group, those who made between $50,000 and $75,000 filed the most returns, at 15.69% of the total filed. Those in the $1,000,000-or-more group filed only 0.22% of the total.
Read more about the number of returns filed as of May 23 and see how they differ between income groups.
Source:
Number of tax returns by income group
| Adjusted gross income | Number of returns | % of total returns |
| Total returns | 132,270,182 | 100.00% |
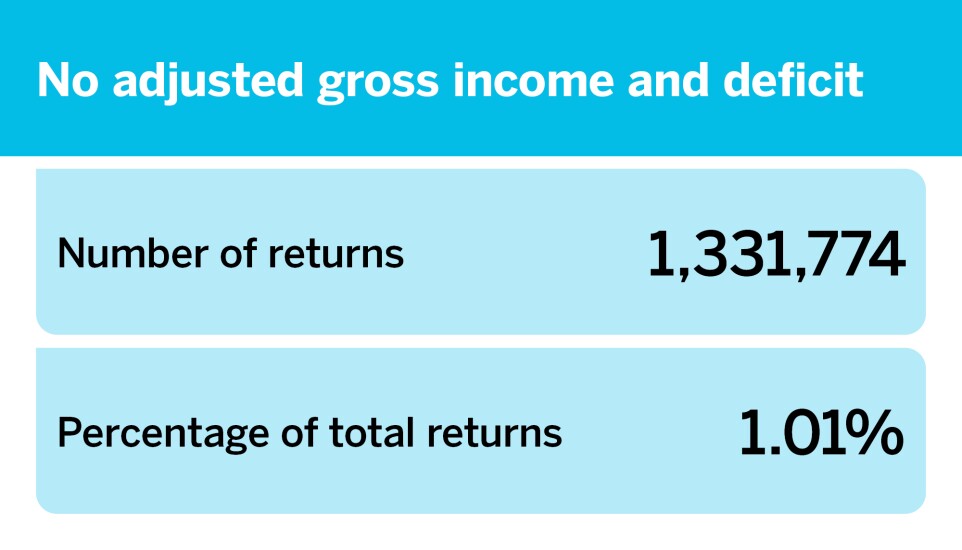
| No adjusted gross income and deficit | 1,331,774 | 1.01% |
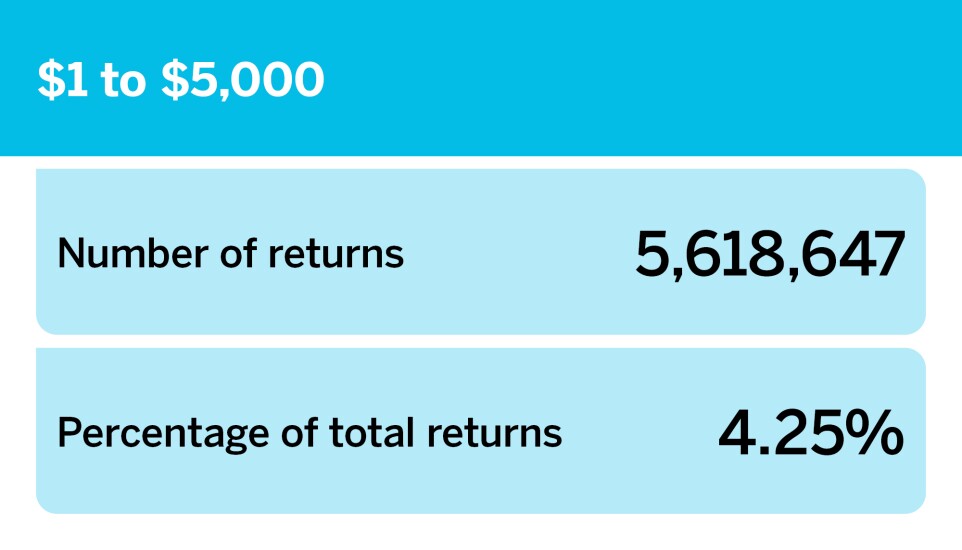
| $1 to $5,000 | 5,618,647 | 4.25% |
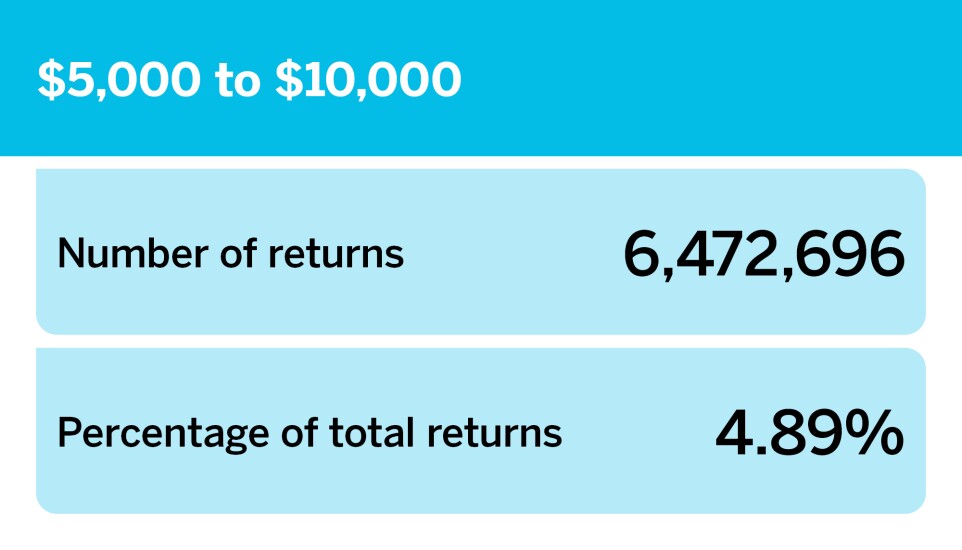
| $5,000 to $10,000 | 6,472,696 | 4.89% |
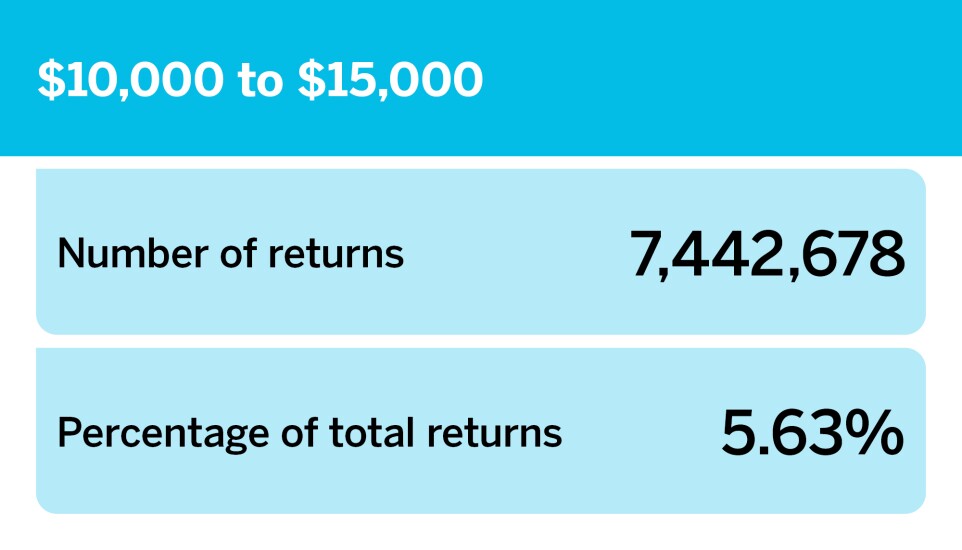
| $10,000 to $15,000 | 7,442,678 | 5.63% |
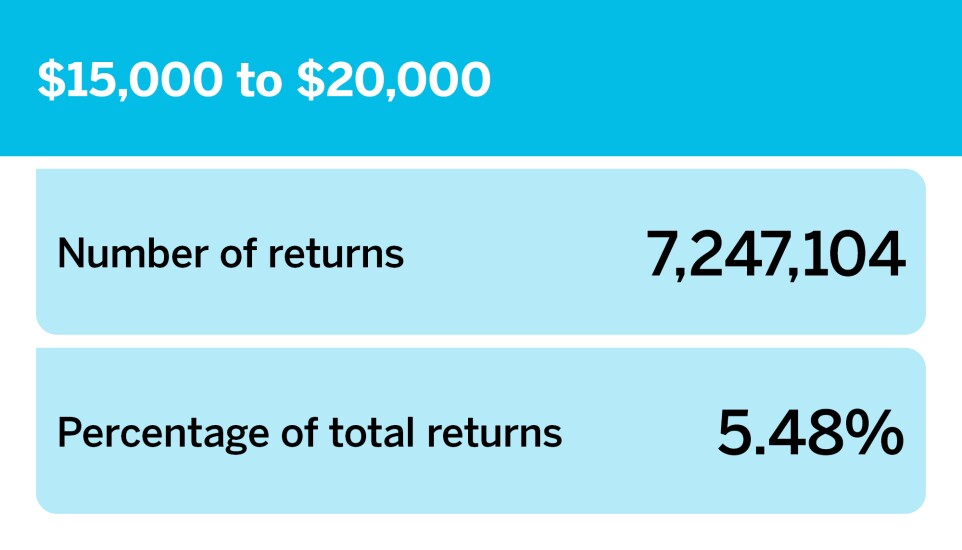
| $15,000 to $20,000 | 7,247,104 | 5.48% |
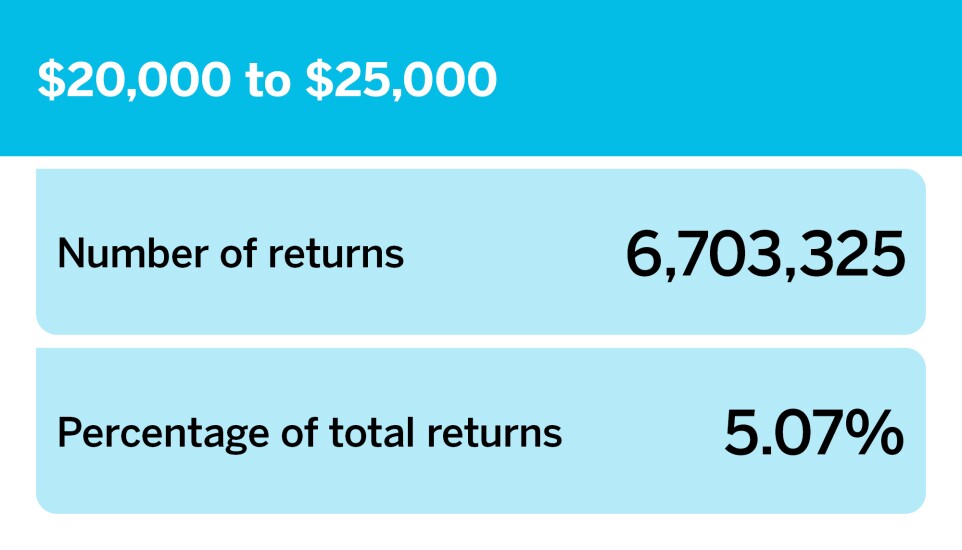
| $20,000 to $25,000 | 6,703,325 | 5.07% |
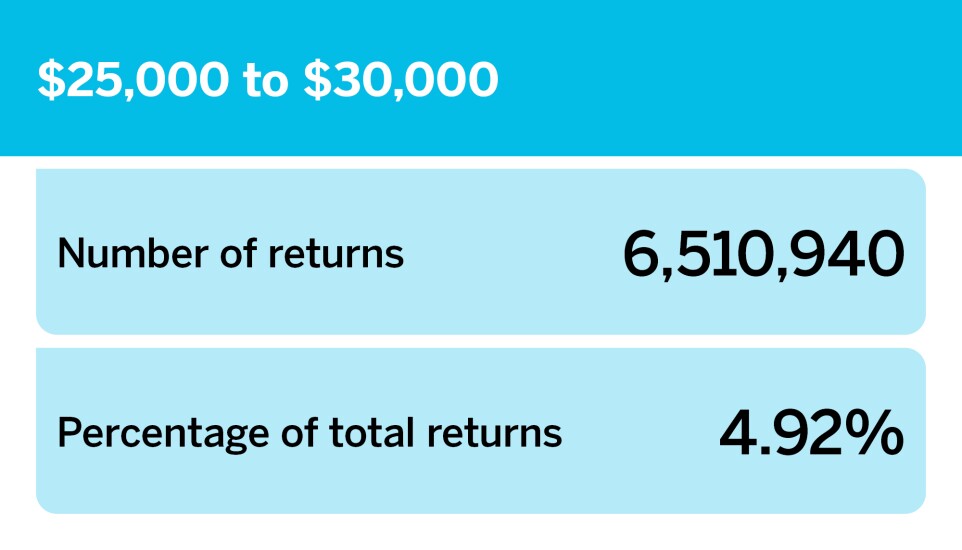
| $25,000 to $30,000 | 6,510,940 | 4.92% |
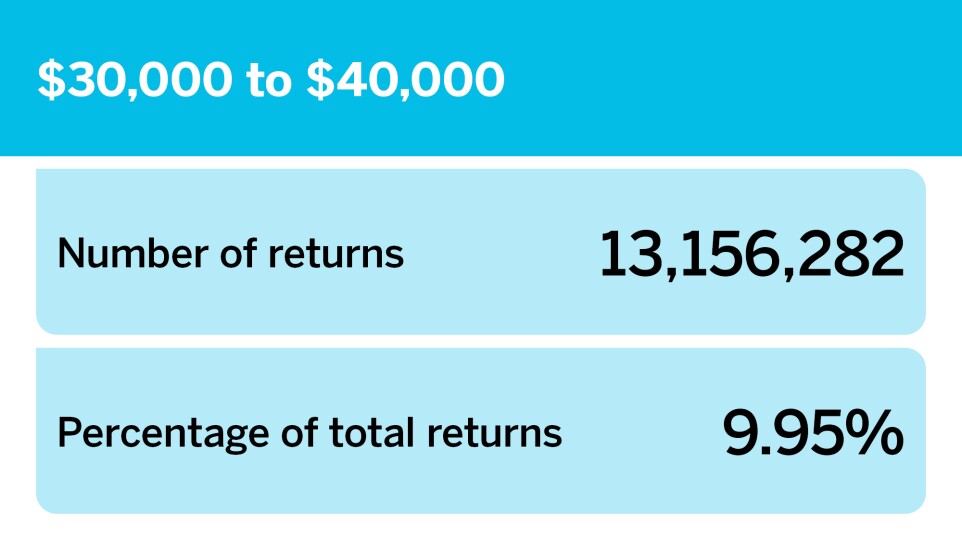
| $30,000 to $40,000 | 13,156,282 | 9.95% |
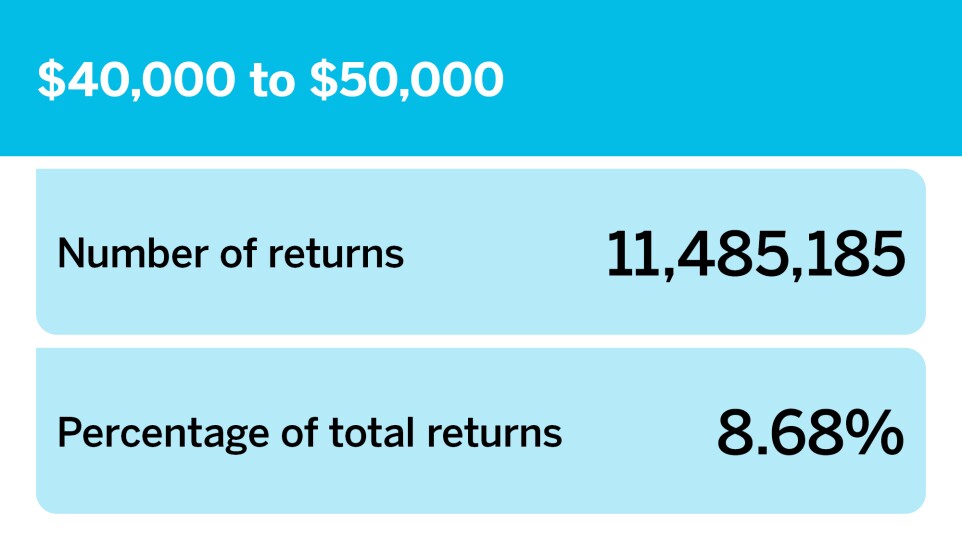
| $40,000 to $50,000 | 11,485,185 | 8.68% |
| $50,000 to $75,000 | 20,751,406 | 15.69% |
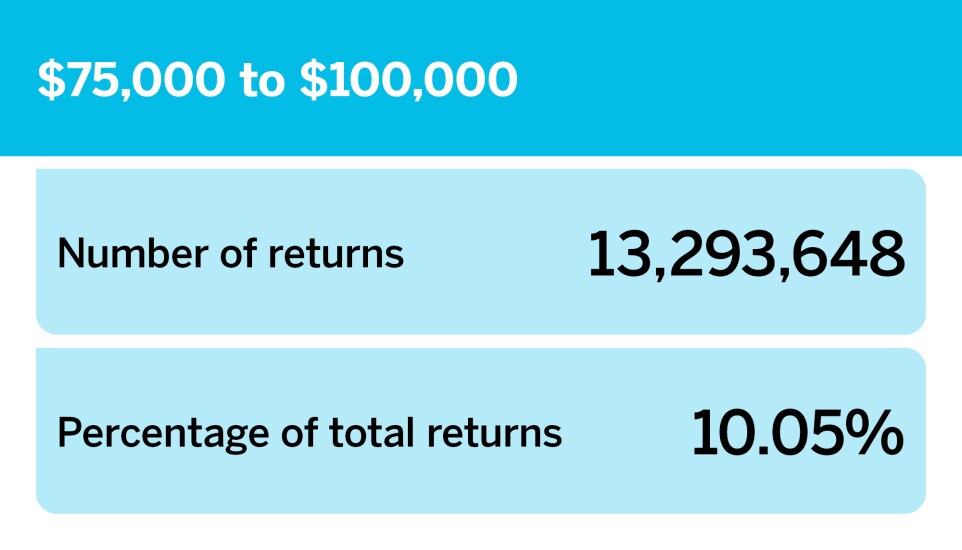
| $75,000 to $100,000 | 13,293,648 | 10.05% |
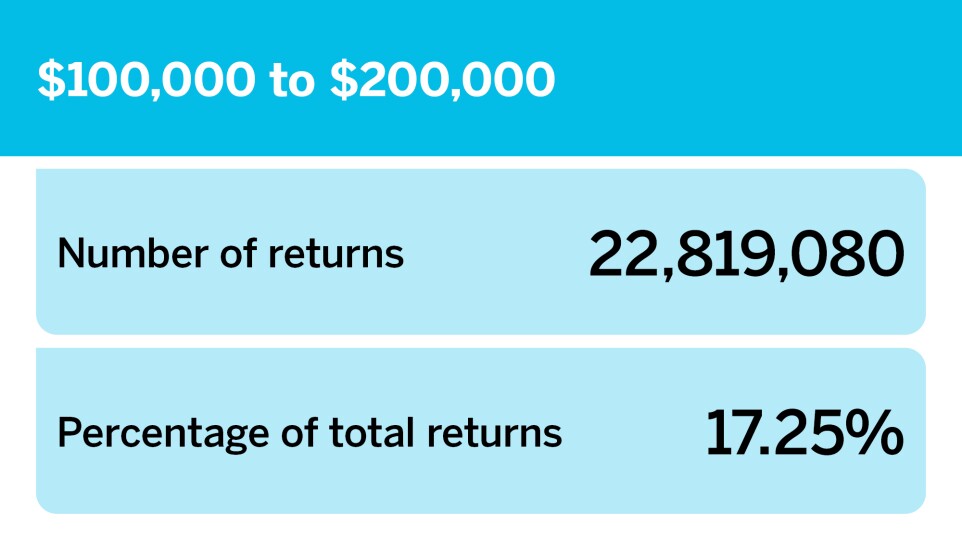
| $100,000 to $200,000 | 22,819,080 | 17.25% |
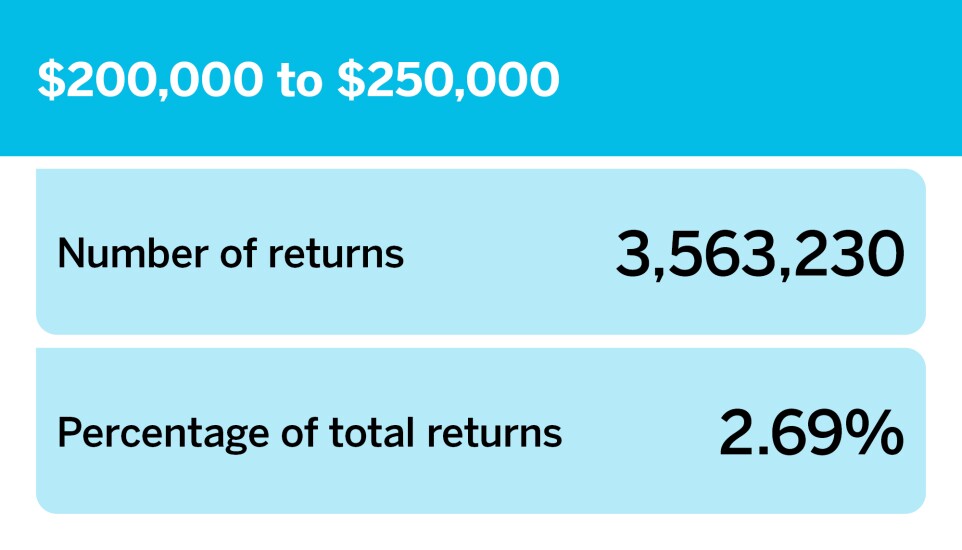
| $200,000 to $250,000 | 3,563,230 | 2.69% |
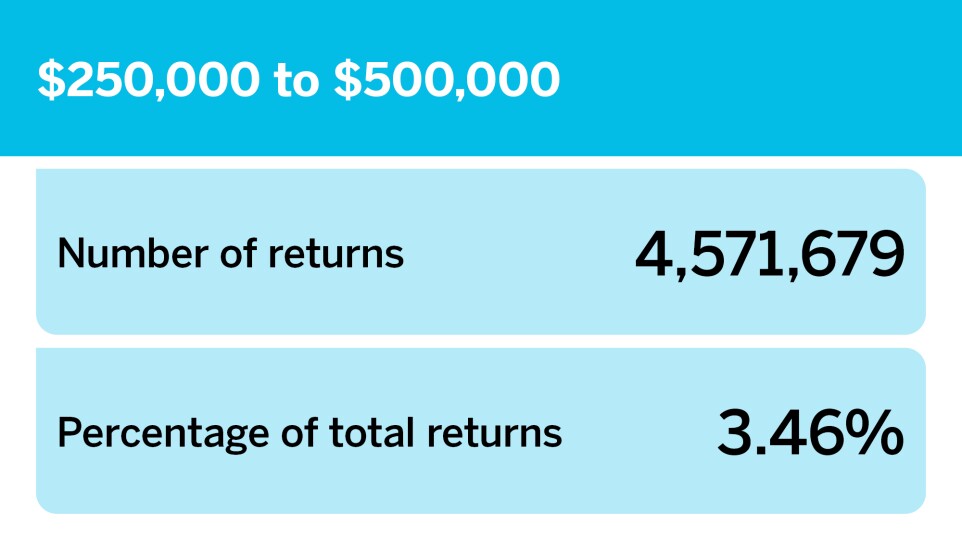
| $250,000 to $500,000 | 4,571,679 | 3.46% |
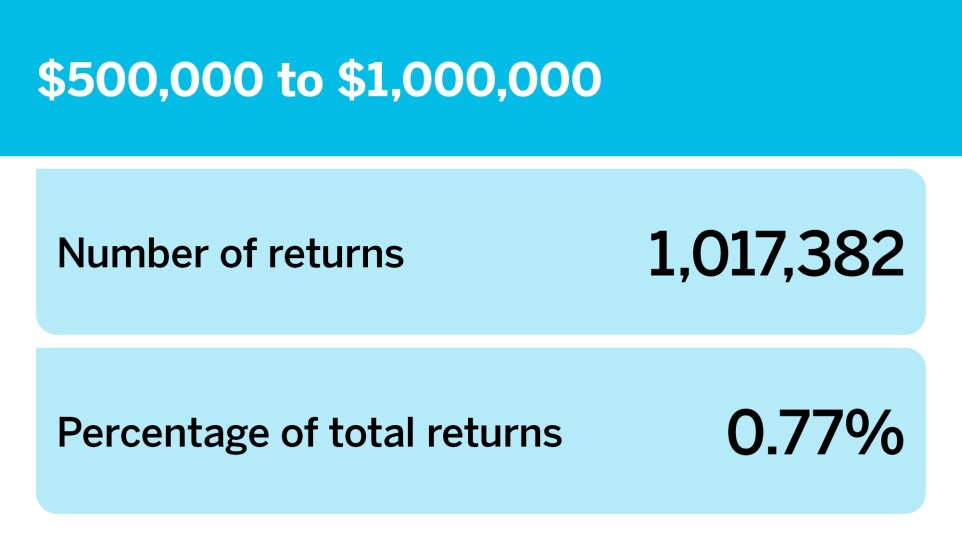
| $500,000 to $1,000,000 | 1,017,382 | 0.77% |
| $1,000,000 or more | 285,126 | 0.22% |
