Enjoy complimentary access to top ideas and insights — selected by our editors.
As the 2025 tax season begins, a look back at 2024 statistics reveals trends that may again drive filing season.
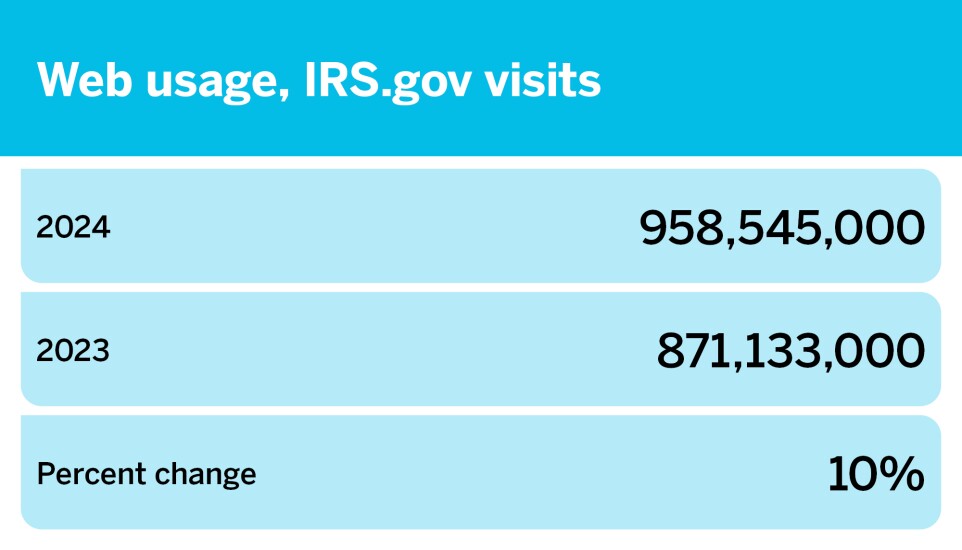
The largest change in filing statistics between 2023 and 2024 was a 10% increase in web usage, or IRS.gov site visits.
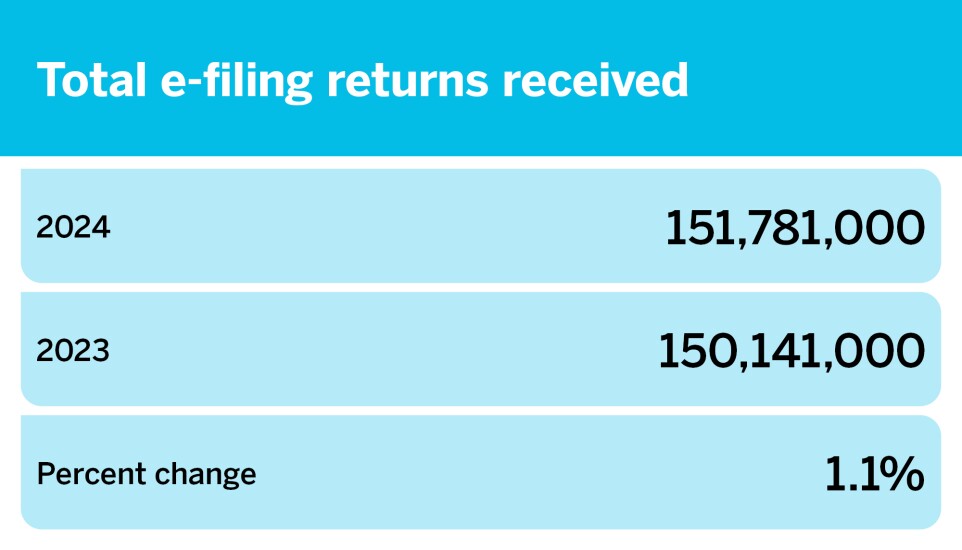
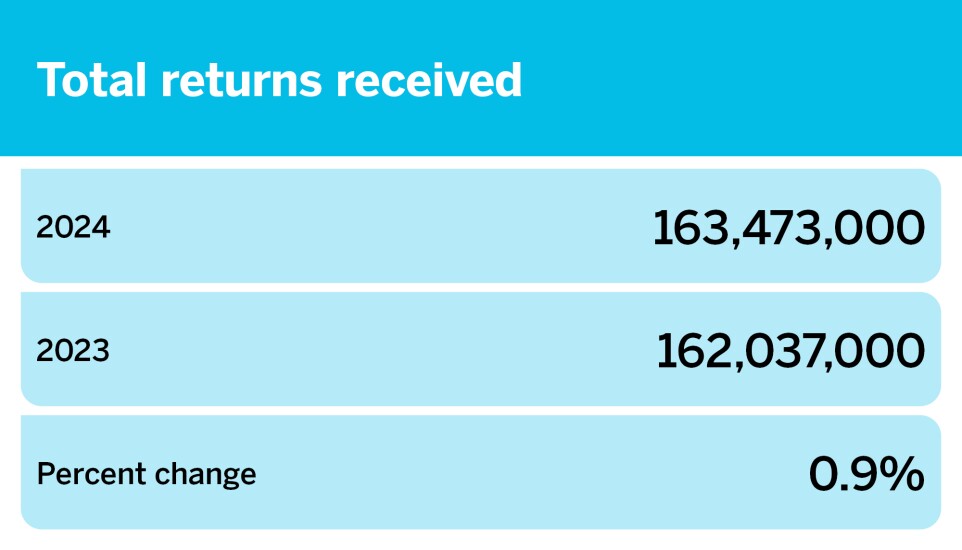
There was a 0.9% increase in total returns received, as well as a 0.3% increase in total returns processed between 2023 and 2024. There was also a 1.1% increase in total e-filing returns received.
While a majority of the filing statistics saw an increase between 2023 and 2024, there were some decreases. Refund amount saw the largest decrease at -1.7%, from 334.861 billion in 2023, to 329.073 billion in 2024.
Read more about the 2024 filing season statistics and how they compare to 2023.
Source: IRS.gov
*Total returns processed includes returns received in the prior or current year and processed in the calendar year.
2024 tax filing season statistics
| Return/Refund category | 2024 | 2023 | % change |
| Total returns received | 163,473,000 | 162,037,000 | 0.9 |
| Total returns processed | 163,515,000* | 162,952,000* | 0.3 |
| Total e-filing returns received | 151,781,000 | 150,141,000 | 1.1 |
| E-filing returns received from tax professionals | 85,642,000 | 85,049,000 | 0.7 |
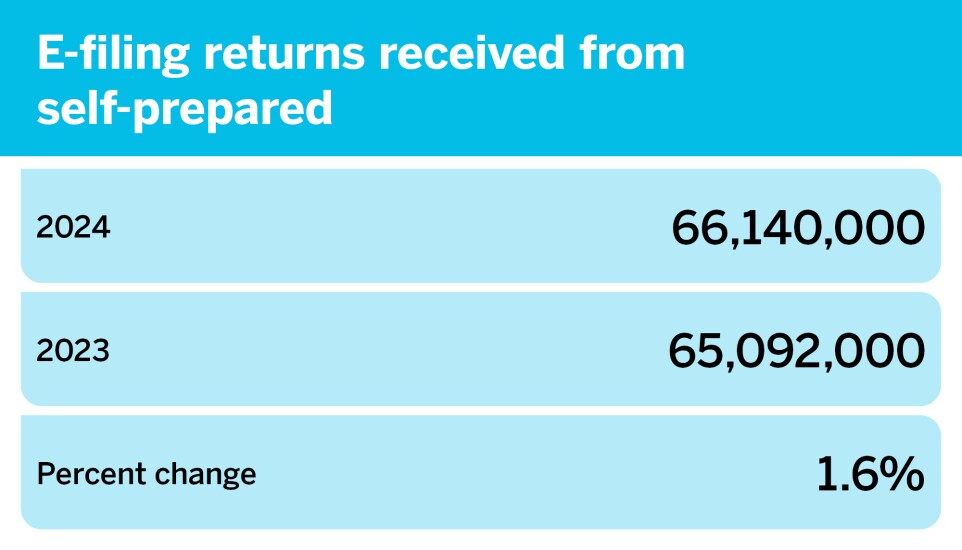
| E-filing returns received from self-prepared | 66,140,000 | 65,092,000 | 1.6 |
| IRS.gov visits | 958,545,000 | 871,133,000 | 10 |
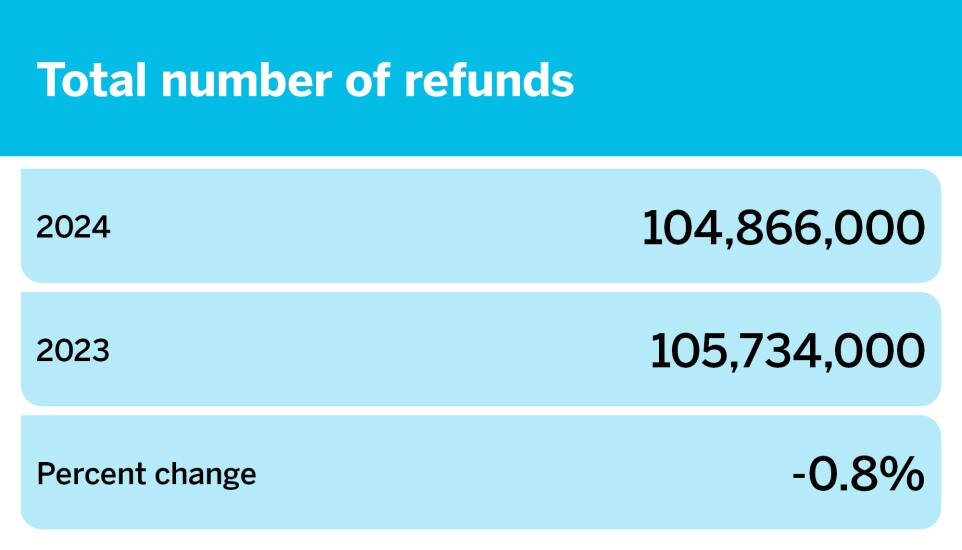
| Total number of refunds | 104,866,000 | 105,734,000 | -0.8 |
| Total amount refunded | $329.073 bn | $334.861 bn | -1.7 |
| Average refund amount | $3,138 | $3,167 | -0.9 |
| Total number of direct deposit refunds | 95,001,000 | 96,592,000 | -1.6 |
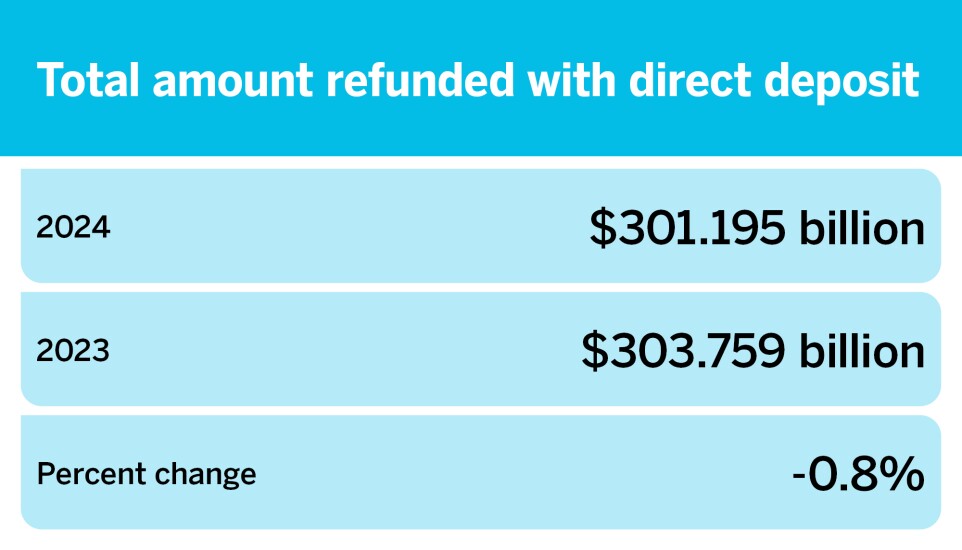
| Total amount refunded with direct deposit | $301.195 bn | $303.759 bn | -0.8 |
| Average direct deposit refund amount | $3,170 | $3,145 | 0.8 |

